
In a fast-moving regulatory environment, understanding your firm’s risk profile is not just about collecting data, it is about seeing it clearly enough to act.
While spreadsheets and static reports can hold valuable information, they often fail to show the bigger picture. This is where risk heat maps become a game-changer for compliance teams.
What is a Risk Heat Map?
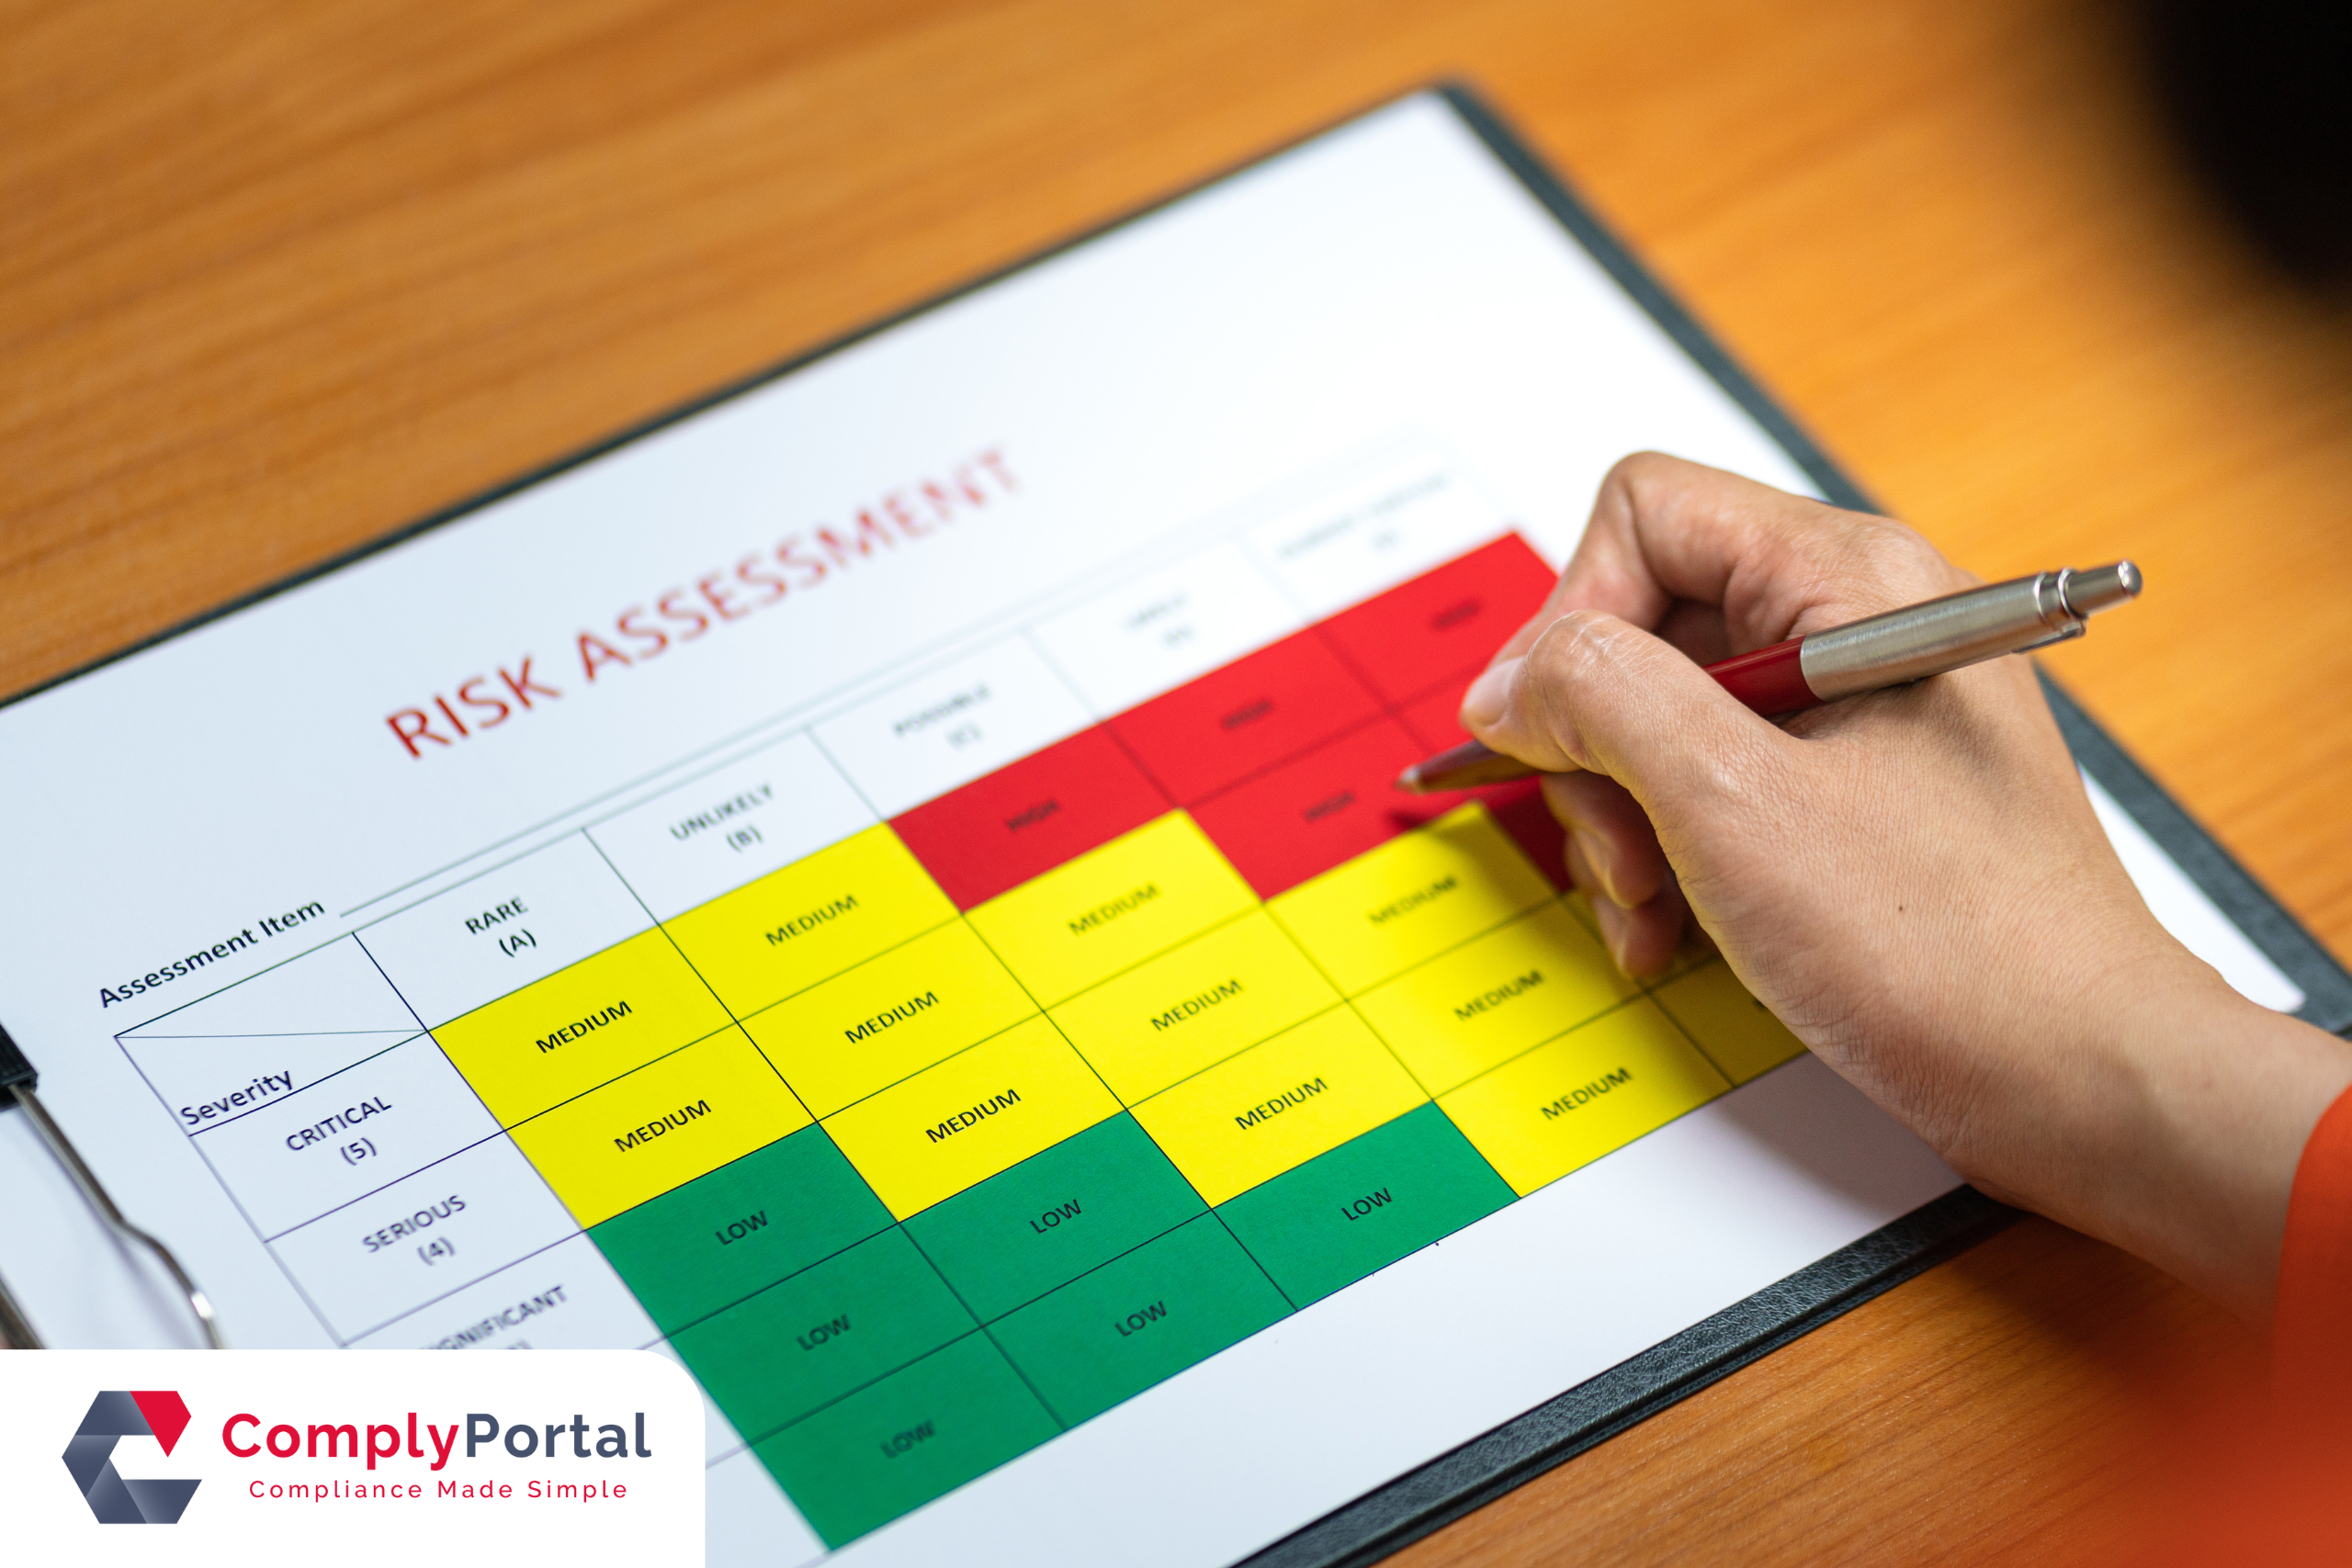
A risk heat map is a visual tool that plots potential risks on a grid according to their likelihood and impact.
By using colour-coded zones, heat maps make it easy to identify which risks need urgent attention and which are lower priority.
In other words, instead of wading through endless lists, you can see immediately:
- Where your biggest vulnerabilities lie
- Which areas are under control
- How risks evolve over time
Why Heat Maps Matter in Compliance
Financial services firms face a wide range of risks, from regulatory breaches and operational failures to emerging threats like cybercrime and ESG non-compliance.
The challenge is not just spotting risks but knowing where to focus limited resources.
Heat maps help by:
- Highlighting critical areas instantly: Red zones demand immediate action.
- Prioritising resources effectively: Focus on high-impact, high-likelihood risks first.
- Supporting data-driven decisions: Combine qualitative and quantitative inputs.
- Improving communication: Complex risk data becomes accessible for senior management and the board.
From Static to Dynamic: The ComplyPortal Approach
Many firms still produce risk maps manually in PowerPoint or Excel, a time-consuming process that quickly becomes outdated.
With ComplyPortal’s digital compliance management platform, heat maps become:
- Real-time: Automatically updated as risks are logged and assessed.
- Interactive: Drill down into individual risks to view details, mitigation plans and owners.
- Customisable: Adjust scoring models, colour scales and risk categories to fit your framework.
This means your risk oversight is always up to date, even during busy reporting periods or periods of staff change.
Better Oversight, Stronger Assurance
Regulators increasingly expect firms to demonstrate not only that they have identified risks, but also that they monitor, review and manage them proactively.
By using heat maps, you can show:
- A clear risk assessment methodology
- Regular review and re-assessment
- Evidence of management engagement
- A structured approach to mitigation
It is a powerful way to combine transparency with operational resilience.
Conclusion
Risk management is not just about ticking boxes; it is about having the insight to act before issues escalate.
Heat maps bring clarity, urgency and focus to risk data, helping compliance teams protect the firm more effectively.
With ComplyPortal, visualising your risks is not just possible, it is effortless.
📅 See how ComplyPortal’s risk heat maps can transform your risk oversight. Book a Demo Today!


